Playa Santa Teresa
An open Pacific beach with shifting sandbanks. La Lora and Suck Rock are named surf references along this stretch; the marker locates the beach area.
Mapped beach sourceCosta Rica surf · 2026-10-09
Today, tomorrow and a seven-day outlook for Costa Rica's Nicoya Peninsula. Compare offshore swell and wind, find your beach, and see where the forecast is uncertain.
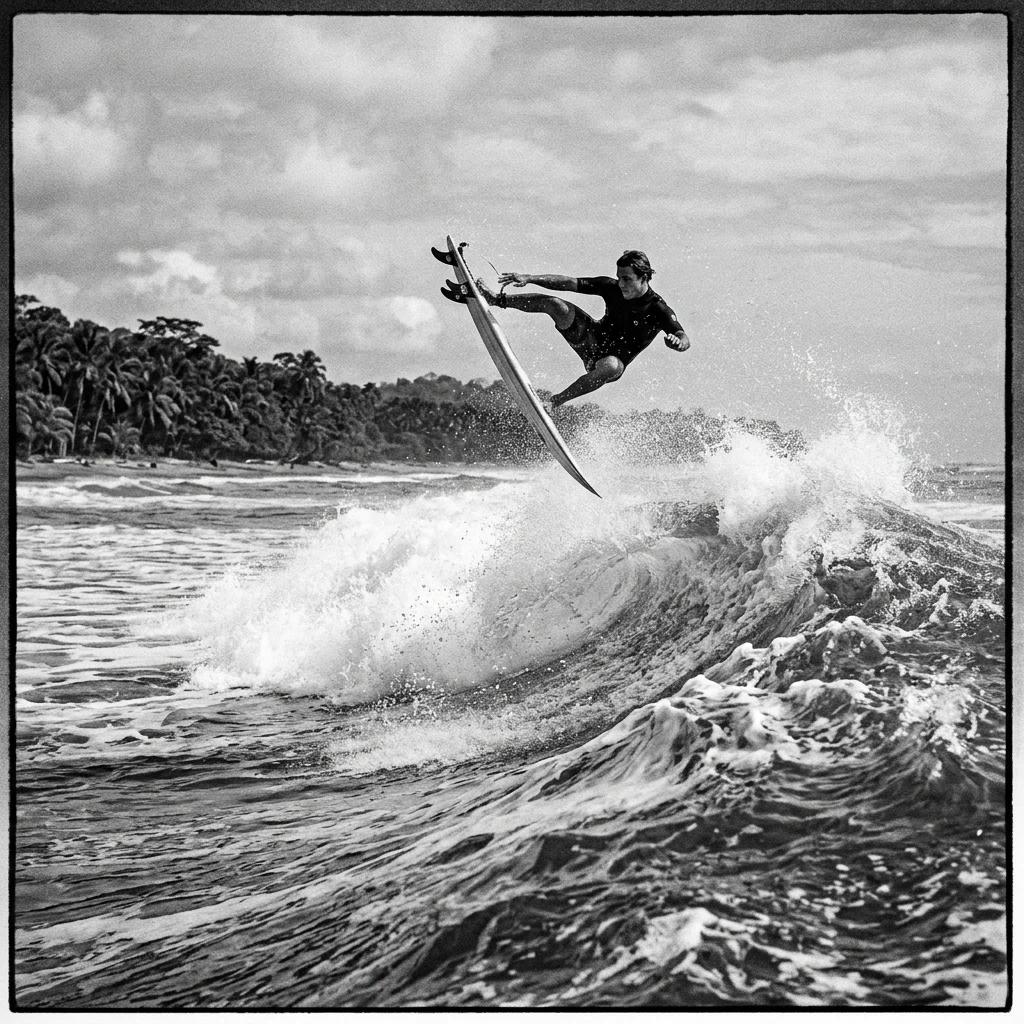
The Pacific beach north of Playa Hermosa on the Nicoya Peninsula. It is distinct from Manzanillo on Costa Rica's Caribbean coast.
Modeled forecast. Report assembled Costa Rica time. Model download and run times are listed below. Current sample: .
Offshore swell
1.3 m / 4.1 ft
14 s · from SW
Coastal wind
3 kt
offshore · from E
Offshore water
29.7°C
Modeled sea surface temperature
Local tides
Unverified
Check MIO-CIMAR and local guidance
All dates and times use Costa Rica time (UTC-6). Heights describe offshore waves. Actual breaking waves depend on the beach and sandbanks.
09:00-11:00 · Lighter-wind daylight window. Thunderstorms are not assessed. Check the beach and local tides before deciding.
Sunrise 05:29 · Sunset 17:26. Hourly samples shown; some source data is interpolated.
Values between native model samples are interpolated. Gust screening checks both ends of each window. Surface gusts and 10 m wind are separate model fields.
| Time | Offshore waves | Primary swell | Wind from | Surface gust | Second wave model |
|---|---|---|---|---|---|
| 1.5 m / 5.1 ft15 s · SSW | 1.3 m / 4.1 ft14 s · SW | 3 kt Eoffshore | 4 kt | 1.2 m / 4.0 ft | |
| 1.5 m / 5.1 ft15 s · SSW | 1.3 m / 4.1 ft14 s · SW | 3 kt ESEoffshore | 4 kt | 1.2 m / 4.0 ft | |
| 1.5 m / 5.1 ft15 s · SSW | 1.3 m / 4.2 ft14 s · SW | 4 kt SEcross-shore | 4 kt | 1.2 m / 4.1 ft | |
| 1.5 m / 5.1 ft15 s · SSW | 1.3 m / 4.2 ft14 s · SW | 5 kt SSEcross-shore | 4 kt | 1.3 m / 4.1 ft | |
| 1.5 m / 5.1 ft15 s · SSW | 1.3 m / 4.2 ft13 s · SW | 7 kt Scross-shore | 5 kt | 1.3 m / 4.2 ft | |
| 1.5 m / 5.0 ft15 s · SSW | 1.3 m / 4.2 ft13 s · SW | 7 kt Scross-shore | 6 kt | 1.3 m / 4.2 ft | |
| 1.5 m / 5.0 ft15 s · SSW | 1.3 m / 4.1 ft13 s · SW | 6 kt Scross-shore | 5 kt | 1.3 m / 4.2 ft | |
| 1.5 m / 5.0 ft15 s · SSW | 1.2 m / 4.1 ft13 s · SW | 5 kt SSEcross-shore | 5 kt | 1.3 m / 4.2 ft | |
| 1.5 m / 5.0 ft15 s · SSW | 1.2 m / 4.0 ft13 s · SW | 4 kt Scross-shore | 5 kt | 1.3 m / 4.1 ft | |
| 1.5 m / 5.0 ft15 s · SSW | 1.2 m / 3.9 ft13 s · SW | 4 kt Scross-shore | 5 kt | 1.3 m / 4.1 ft | |
| 1.5 m / 5.0 ft15 s · SSW | 1.2 m / 3.9 ft13 s · SW | 4 kt SSEcross-shore | 4 kt | 1.2 m / 4.1 ft | |
| 1.5 m / 5.0 ft15 s · SSW | 1.2 m / 3.9 ft13 s · SW | 2 kt SElight | 3 kt | 1.2 m / 4.0 ft | |
| 1.5 m / 5.0 ft15 s · SSW | 1.2 m / 3.9 ft13 s · SW | 3 kt ESEoffshore | 4 kt | 1.2 m / 4.0 ft | |
| 1.5 m / 5.0 ft15 s · SSW | 1.2 m / 3.9 ft13 s · SW | 3 kt Eoffshore | 4 kt | 1.2 m / 4.0 ft | |
| 1.5 m / 5.0 ft15 s · SSW | 1.2 m / 3.9 ft13 s · SW | 3 kt Elight | 3 kt | 1.2 m / 4.0 ft | |
| 1.5 m / 5.0 ft15 s · SSW | 1.2 m / 3.9 ft13 s · SW | 3 kt Elight | 3 kt | 1.2 m / 4.0 ft |
07:00-09:00 · Lighter-wind daylight window. Thunderstorms are not assessed. Check the beach and local tides before deciding.
Sunrise 05:29 · Sunset 17:26. Hourly samples shown; some source data is interpolated.
Values between native model samples are interpolated. Gust screening checks both ends of each window. Surface gusts and 10 m wind are separate model fields.
| Time | Offshore waves | Primary swell | Wind from | Surface gust | Second wave model |
|---|---|---|---|---|---|
| 1.5 m / 5.0 ft15 s · SSW | 1.2 m / 3.9 ft13 s · SW | 3 kt ENElight | 3 kt | 1.2 m / 4.0 ft | |
| 1.5 m / 5.0 ft14 s · SSW | 1.2 m / 3.9 ft13 s · SW | 2 kt Elight | 2 kt | 1.2 m / 4.0 ft | |
| 1.5 m / 5.0 ft14 s · SSW | 1.2 m / 3.9 ft13 s · SW | 3 kt ENElight | 3 kt | 1.2 m / 4.0 ft | |
| 1.5 m / 5.0 ft14 s · SSW | 1.2 m / 3.9 ft13 s · SW | 2 kt ENElight | 3 kt | 1.2 m / 4.0 ft | |
| 1.5 m / 5.0 ft14 s · SSW | 1.2 m / 3.9 ft13 s · SW | 3 kt NEoffshore | 3 kt | 1.2 m / 4.0 ft | |
| 1.5 m / 5.0 ft14 s · SSW | 1.2 m / 3.9 ft13 s · SW | 3 kt ENElight | 3 kt | 1.2 m / 4.0 ft | |
| 1.5 m / 5.1 ft14 s · SSW | 1.2 m / 3.9 ft13 s · SW | 3 kt ENEoffshore | 4 kt | 1.2 m / 4.0 ft | |
| 1.5 m / 5.1 ft14 s · SSW | 1.2 m / 3.9 ft13 s · SW | 3 kt Elight | 3 kt | 1.2 m / 4.0 ft | |
| 1.5 m / 5.1 ft14 s · SSW | 1.2 m / 3.9 ft12 s · SW | 2 kt ESElight | 3 kt | 1.2 m / 4.0 ft | |
| 1.5 m / 5.1 ft14 s · SSW | 1.2 m / 3.9 ft12 s · SW | 3 kt SEoffshore | 4 kt | 1.2 m / 4.0 ft | |
| 1.6 m / 5.1 ft14 s · SSW | 1.2 m / 3.9 ft12 s · SW | 4 kt SSEcross-shore | 4 kt | 1.2 m / 4.0 ft | |
| 1.6 m / 5.1 ft14 s · SSW | 1.2 m / 3.9 ft12 s · SW | 5 kt SSEcross-shore | 4 kt | 1.2 m / 4.0 ft | |
| 1.6 m / 5.1 ft14 s · SSW | 1.2 m / 3.9 ft12 s · SW | 5 kt Scross-shore | 5 kt | 1.2 m / 4.0 ft | |
| 1.6 m / 5.1 ft14 s · SSW | 1.2 m / 3.9 ft12 s · SW | 6 kt Scross-shore | 5 kt | 1.2 m / 4.0 ft | |
| 1.6 m / 5.1 ft13 s · SSW | 1.2 m / 3.9 ft12 s · SW | 6 kt Scross-shore | 4 kt | 1.2 m / 4.0 ft | |
| 1.6 m / 5.1 ft13 s · SSW | 1.2 m / 3.9 ft12 s · SW | 5 kt Scross-shore | 5 kt | 1.2 m / 3.9 ft | |
| 1.6 m / 5.1 ft13 s · SSW | 1.2 m / 3.9 ft12 s · SW | 4 kt Scross-shore | 4 kt | 1.2 m / 3.9 ft | |
| 1.5 m / 5.1 ft13 s · SSW | 1.2 m / 3.9 ft12 s · SW | 3 kt SSWcross-shore | 4 kt | 1.2 m / 3.9 ft | |
| 1.5 m / 5.1 ft13 s · SSW | 1.2 m / 3.9 ft12 s · SW | 3 kt SSElight | 3 kt | 1.2 m / 3.9 ft | |
| 1.5 m / 5.1 ft13 s · SSW | 1.2 m / 3.9 ft12 s · SW | 1 kt SSElight | 1 kt | 1.2 m / 3.9 ft | |
| 1.5 m / 5.1 ft13 s · SSW | 1.2 m / 3.9 ft12 s · SW | 2 kt ESElight | 2 kt | 1.2 m / 3.9 ft | |
| 1.5 m / 5.1 ft13 s · SSW | 1.2 m / 4.0 ft12 s · SW | 2 kt Elight | 2 kt | 1.2 m / 3.9 ft | |
| 1.5 m / 5.0 ft13 s · SSW | 1.2 m / 4.0 ft12 s · SW | 2 kt ENElight | 2 kt | 1.2 m / 3.9 ft | |
| 1.5 m / 5.0 ft13 s · SSW | 1.2 m / 3.9 ft12 s · SW | 3 kt ENEoffshore | 3 kt | 1.2 m / 3.9 ft |
06:00-08:00 · Lighter-wind daylight window. Thunderstorms are not assessed. Check the beach and local tides before deciding.
Sunrise 05:29 · Sunset 17:25. Hourly samples shown; some source data is interpolated.
Values between native model samples are interpolated. Gust screening checks both ends of each window. Surface gusts and 10 m wind are separate model fields.
| Time | Offshore waves | Primary swell | Wind from | Surface gust | Second wave model |
|---|---|---|---|---|---|
| 1.5 m / 5.0 ft13 s · SSW | 1.2 m / 3.9 ft12 s · SW | 4 kt ENEoffshore | 4 kt | 1.2 m / 3.9 ft | |
| 1.5 m / 4.9 ft13 s · SSW | 1.2 m / 3.9 ft12 s · SW | 4 kt ENEoffshore | 5 kt | 1.2 m / 3.9 ft | |
| 1.5 m / 4.9 ft13 s · SSW | 1.2 m / 3.9 ft12 s · SW | 3 kt NEcross-shore | 3 kt | 1.2 m / 3.9 ft | |
| 1.5 m / 4.9 ft13 s · SW | 1.2 m / 3.9 ft12 s · SW | 4 kt ENEoffshore | 4 kt | 1.2 m / 3.9 ft | |
| 1.5 m / 4.9 ft13 s · SW | 1.2 m / 3.9 ft12 s · SW | 4 kt ENEoffshore | 4 kt | 1.2 m / 3.8 ft | |
| 1.5 m / 4.8 ft13 s · SW | 1.2 m / 3.9 ft12 s · SW | 3 kt NElight | 3 kt | 1.2 m / 3.8 ft | |
| 1.5 m / 4.8 ft13 s · SW | 1.2 m / 3.9 ft12 s · SW | 2 kt NElight | 3 kt | 1.2 m / 3.8 ft | |
| 1.5 m / 4.8 ft13 s · SW | 1.2 m / 3.9 ft12 s · SW | 3 kt ENElight | 3 kt | 1.2 m / 3.8 ft | |
| 1.5 m / 4.8 ft13 s · SW | 1.2 m / 3.9 ft12 s · SW | 3 kt Eoffshore | 4 kt | 1.1 m / 3.7 ft | |
| 1.4 m / 4.8 ft13 s · SW | 1.2 m / 3.9 ft12 s · SW | 3 kt Eoffshore | 3 kt | 1.1 m / 3.7 ft | |
| 1.4 m / 4.8 ft13 s · SW | 1.2 m / 3.9 ft12 s · SW | 3 kt SEoffshore | 3 kt | 1.1 m / 3.7 ft | |
| 1.4 m / 4.8 ft13 s · SW | 1.2 m / 3.9 ft12 s · SW | 5 kt SSEcross-shore | 4 kt | 1.1 m / 3.8 ft | |
| 1.4 m / 4.8 ft13 s · SW | 1.2 m / 3.9 ft12 s · SW | 6 kt Scross-shore | 5 kt | 1.1 m / 3.8 ft | |
| 1.4 m / 4.7 ft13 s · SW | 1.2 m / 3.9 ft12 s · SW | 6 kt Scross-shore | 5 kt | 1.2 m / 3.8 ft | |
| 1.4 m / 4.7 ft13 s · SW | 1.2 m / 3.9 ft12 s · SW | 6 kt SSEcross-shore | 5 kt | 1.2 m / 3.8 ft | |
| 1.4 m / 4.7 ft13 s · SW | 1.2 m / 3.9 ft12 s · SW | 6 kt Scross-shore | 6 kt | 1.2 m / 3.8 ft | |
| 1.4 m / 4.7 ft13 s · SW | 1.2 m / 3.8 ft11 s · SW | 6 kt Scross-shore | 6 kt | 1.2 m / 3.8 ft | |
| 1.4 m / 4.7 ft13 s · SW | 1.1 m / 3.7 ft11 s · SW | 4 kt Scross-shore | 5 kt | 1.2 m / 3.8 ft | |
| 1.4 m / 4.7 ft13 s · SW | 1.1 m / 3.6 ft10 s · SW | 3 kt Scross-shore | 4 kt | 1.2 m / 3.8 ft | |
| 1.4 m / 4.7 ft13 s · SW | 1.1 m / 3.5 ft10 s · SW | 2 kt SElight | 3 kt | 1.2 m / 3.8 ft | |
| 1.4 m / 4.7 ft13 s · SW | 1.1 m / 3.5 ft10 s · SW | 3 kt Eoffshore | 4 kt | 1.2 m / 3.8 ft | |
| 1.4 m / 4.7 ft13 s · SW | 1.0 m / 3.4 ft10 s · SW | 4 kt ENEoffshore | 4 kt | 1.2 m / 3.8 ft | |
| 1.4 m / 4.7 ft13 s · SW | 1.0 m / 3.3 ft10 s · SW | 4 kt NEoffshore | 4 kt | 1.2 m / 3.8 ft | |
| 1.4 m / 4.7 ft13 s · SW | 1.0 m / 3.2 ft10 s · SW | 5 kt NEcross-shore | 5 kt | 1.2 m / 3.9 ft |
Longer-range outlook: use the trend and check again nearer the day. Precise surf windows are withheld.
Sunrise 05:29 · Sunset 17:25. Three-hour samples shown.
Values between native model samples are interpolated. Gust screening checks both ends of each window. Surface gusts and 10 m wind are separate model fields.
| Time | Offshore waves | Primary swell | Wind from | Surface gust | Second wave model |
|---|---|---|---|---|---|
| 1.4 m / 4.7 ft13 s · SW | 0.9 m / 3.1 ft9 s · SW | 4 kt NNEcross-shore | 4 kt | 1.2 m / 3.9 ft | |
| 1.4 m / 4.7 ft13 s · SW | 1.2 m / 4.1 ft12 s · SW | 4 kt Ncross-shore | 4 kt | 1.2 m / 4.0 ft | |
| 1.4 m / 4.7 ft14 s · SW | 1.2 m / 4.1 ft12 s · SW | 4 kt Ncross-shore | 4 kt | 1.2 m / 4.0 ft | |
| 1.4 m / 4.8 ft14 s · SW | 1.3 m / 4.1 ft12 s · SW | 3 kt Wlight | 3 kt | 1.2 m / 4.1 ft | |
| 1.5 m / 4.8 ft14 s · SW | 1.3 m / 4.2 ft13 s · SW | 2 kt WSWlight | 2 kt | 1.2 m / 4.1 ft | |
| 1.5 m / 4.8 ft14 s · SW | 1.3 m / 4.2 ft13 s · SW | 3 kt Wonshore | 4 kt | 1.3 m / 4.1 ft | |
| 1.5 m / 4.8 ft14 s · SW | 1.3 m / 4.2 ft13 s · SW | 4 kt NWcross-shore | 4 kt | 1.3 m / 4.2 ft | |
| 1.5 m / 4.9 ft14 s · SW | 1.3 m / 4.3 ft13 s · SW | 2 kt Nlight | 2 kt | 1.3 m / 4.2 ft |
Longer-range outlook: use the trend and check again nearer the day. Precise surf windows are withheld.
Sunrise 05:29 · Sunset 17:24. Three-hour samples shown.
Values between native model samples are interpolated. Gust screening checks both ends of each window. Surface gusts and 10 m wind are separate model fields.
| Time | Offshore waves | Primary swell | Wind from | Surface gust | Second wave model |
|---|---|---|---|---|---|
| 1.5 m / 4.9 ft14 s · SW | 1.3 m / 4.4 ft12 s · SW | 2 kt Nlight | 2 kt | 1.3 m / 4.3 ft | |
| 1.5 m / 4.9 ft14 s · SW | 1.4 m / 4.5 ft12 s · SW | 2 kt ENElight | 2 kt | 1.3 m / 4.3 ft | |
| 1.5 m / 4.9 ft13 s · SW | 1.5 m / 4.9 ft11 s · SW | 4 kt NEoffshore | 4 kt | 1.3 m / 4.3 ft | |
| 1.5 m / 4.9 ft13 s · SW | 1.5 m / 4.9 ft11 s · SW | 2 kt ENElight | 3 kt | 1.3 m / 4.3 ft | |
| 1.5 m / 4.9 ft13 s · SW | 1.5 m / 4.9 ft11 s · SW | 5 kt SWcross-shore | 4 kt | 1.3 m / 4.3 ft | |
| 1.5 m / 5.0 ft13 s · SW | 1.5 m / 5.0 ft11 s · SW | 5 kt SWcross-shore | 4 kt | 1.3 m / 4.3 ft | |
| 1.5 m / 5.0 ft13 s · SW | 1.5 m / 5.0 ft11 s · SW | 2 kt Wlight | 3 kt | 1.3 m / 4.4 ft | |
| 1.5 m / 5.0 ft13 s · SW | 1.5 m / 5.0 ft11 s · SW | 2 kt NElight | 2 kt | 1.3 m / 4.4 ft |
Longer-range outlook: use the trend and check again nearer the day. Precise surf windows are withheld.
Sunrise 05:29 · Sunset 17:24. Three-hour samples shown.
Values between native model samples are interpolated. Gust screening checks both ends of each window. Surface gusts and 10 m wind are separate model fields.
| Time | Offshore waves | Primary swell | Wind from | Surface gust | Second wave model |
|---|---|---|---|---|---|
| 1.5 m / 5.0 ft13 s · SW | 1.5 m / 4.9 ft11 s · SW | 3 kt NEcross-shore | 3 kt | 1.3 m / 4.3 ft | |
| 1.5 m / 4.9 ft13 s · SW | 1.3 m / 4.2 ft11 s · SW | 2 kt NElight | 2 kt | 1.3 m / 4.4 ft | |
| 1.5 m / 4.8 ft13 s · SW | 1.3 m / 4.2 ft11 s · SW | 3 kt NEcross-shore | 3 kt | 1.3 m / 4.3 ft | |
| 1.4 m / 4.7 ft13 s · SW | 1.2 m / 4.0 ft11 s · SW | 0 kt WNWlight | 1 kt | 1.3 m / 4.3 ft | |
| 1.4 m / 4.6 ft13 s · SW | 1.2 m / 3.9 ft11 s · SW | 5 kt SSWcross-shore | 4 kt | 1.3 m / 4.2 ft | |
| 1.4 m / 4.5 ft13 s · SW | 1.2 m / 3.8 ft11 s · SW | 4 kt Scross-shore | 4 kt | 1.3 m / 4.2 ft | |
| 1.3 m / 4.4 ft12 s · SW | 1.2 m / 3.8 ft12 s · SW | 3 kt SEcross-shore | 4 kt | 1.3 m / 4.1 ft | |
| 1.3 m / 4.3 ft12 s · SW | 1.1 m / 3.7 ft12 s · SW | 3 kt Elight | 3 kt | 1.2 m / 4.0 ft |
Longer-range outlook: use the trend and check again nearer the day. Precise surf windows are withheld.
Sunrise 05:29 · Sunset 17:23. Three-hour samples shown.
Values between native model samples are interpolated. Gust screening checks both ends of each window. Surface gusts and 10 m wind are separate model fields.
| Time | Offshore waves | Primary swell | Wind from | Surface gust | Second wave model |
|---|---|---|---|---|---|
| 1.3 m / 4.3 ft12 s · SW | 1.1 m / 3.7 ft12 s · SW | 4 kt Eoffshore | 4 kt | 1.2 m / 4.0 ft | |
| 1.3 m / 4.2 ft12 s · SW | 1.1 m / 3.6 ft12 s · SW | 4 kt ENEoffshore | 4 kt | 1.2 m / 3.9 ft | |
| 1.3 m / 4.2 ft12 s · SW | 1.1 m / 3.6 ft11 s · SW | 3 kt NEoffshore | 3 kt | 1.2 m / 3.8 ft | |
| 1.3 m / 4.1 ft13 s · SW | 1.1 m / 3.5 ft11 s · SW | 2 kt NWlight | 3 kt | 1.1 m / 3.7 ft | |
| 1.2 m / 4.1 ft13 s · SW | 1.0 m / 3.4 ft11 s · SW | 6 kt WSWonshore | 4 kt | 1.1 m / 3.7 ft | |
| 1.2 m / 4.1 ft13 s · SW | 1.0 m / 3.3 ft11 s · SW | 5 kt WSWonshore | 5 kt | 1.1 m / 3.6 ft | |
| 1.2 m / 4.0 ft13 s · SW | 1.0 m / 3.1 ft11 s · SW | 2 kt SSElight | 2 kt | 1.1 m / 3.6 ft | |
| 1.2 m / 4.0 ft13 s · SW | 0.9 m / 3.0 ft11 s · SW | 2 kt ESElight | 2 kt | 1.1 m / 3.5 ft |
Markers locate named beach areas from OpenStreetMap beach polygons, checked October 9, 2026. Exact surf peaks, parking and water-entry points have not been field-verified.
Beach geography © OpenStreetMap contributors, ODbL. View the source for Playa Manzanillo.
An open Pacific beach with shifting sandbanks. La Lora and Suck Rock are named surf references along this stretch; the marker locates the beach area.
Mapped beach sourceThe beach by the Santa Teresa and Mal País crossroads, mapped as Playa del Carmen. Surf schools use this sandy stretch when conditions suit their students.
Mapped beach sourceThe sandy beach north of Santa Teresa on the Nicoya Peninsula. This is Playa Hermosa near Santa Teresa, not the beach of the same name near Jacó.
Mapped beach sourceA rocky coastline south of Playa Carmen with reef and point setups. The marker represents Playa Malpaís, not the exact location of Mar Azul, Sunset Reef or Punta Barrigona.
Mapped beach sourceThe Pacific beach north of Playa Hermosa on the Nicoya Peninsula. It is distinct from Manzanillo on Costa Rica's Caribbean coast.
Mapped beach sourceAn east-facing coast across the peninsula from Santa Teresa. This open-water outlook uses the Montezuma side of the peninsula and does not reuse Santa Teresa's west-coast forecast.
Mapped beach sourceThe beach near Cabuya village on the eastern side of the peninsula. Offshore conditions here are an ocean outlook, not a prediction for a particular reef or island crossing.
Mapped beach sourceThe free baseline uses NOAA GFS-Wave and GFS for offshore waves, swell, wind and gusts. When connected, Copernicus Marine MFWAM provides the finer wave model, with NOAA shown as a comparison and Copernicus ocean temperature separately. The source records below identify which models actually supplied this report. Attribution: NOAA/NCEP and, when present, EU Copernicus Marine Service and Météo-France.
Significant wave height is the modeled average height of the highest third of waves in open water. It is not the height of a breaking surf wave. Individual waves can be larger. NOAA waves use an approximately 16 km grid and wind approximately 27 km; the optional Copernicus grids are approximately 8 km. They cannot resolve individual reefs, shifting sandbanks or every sheltered cove. Nearby beaches can share a model cell. Period definitions differ by model and wave partition.
The lighter-wind suggestion compares consecutive two-hour daylight periods in the next three days. It prefers light or offshore wind and withholds suggestions for missing wave or wind inputs, stronger wind or gusts, stale data, or substantial disagreement when two wave models are available. NOAA does not supply a thunderstorm assessment here; missing storm and comparison information is stated beside each suggestion. Offshore directions use approximate mapped coastal orientation. This is an editorial wind filter, not a calibrated surf-quality score or safety recommendation.
Collection is checked every 30 minutes. A new NOAA cycle downloads gradually within the provider's request limits, while the previous forecast remains available. NOAA model cycles are cached and reused; assembling a report does not mean a new model run. A report older than 90 minutes is marked delayed and receives no window suggestions. After six hours it is withheld. NOAA provides native hourly samples through forecast hour 120 and three-hour samples later. Values between model samples are interpolated, with conservative gust interpolation. Initialization times are shown only when the provider explicitly supplies them.
Tides: verified local tide predictions are not connected. We have removed inferred tide phases and exact high/low times from these reports. Consult UCR's MIO-CIMAR tide predictions and confirm the appropriate station and local differences. Tide times from another port cannot be treated as exact Santa Teresa tides.
No beach observations, calibrated breaking-wave model, rip-current detection or live lifeguard report are connected. Check conditions at the beach, local warnings and your own ability. Read the surf safety guide.
| Model | Actual grid center | Downloaded, Costa Rica time | Model run, Costa Rica time |
|---|---|---|---|
| Copernicus Marine MFWAM, approximately 8 km | 9.6667, -85.2500 | Oct 9, 2026, 08:41 | Unavailable |
| NOAA GFS-Wave, approximately 16 km | 9.6667, -85.3333 | Oct 9, 2026, 07:46 | Oct 9, 2026, 00:00 |
| NOAA GFS wind and gust, approximately 27 km | 9.7500, -85.2500 | Oct 9, 2026, 08:00 | Oct 9, 2026, 00:00 |
| Copernicus Marine surface ocean temperature, approximately 8 km | 9.6667, -85.2500 | Oct 9, 2026, 08:41 | Unavailable |